Three “Value” Measurement Systems
Prices Relative to “Fair Value” ~ Three Measurements
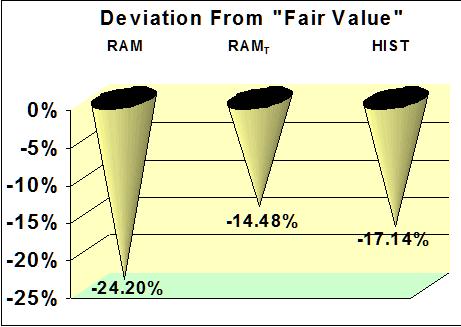
The chart shows readings from three of Dr. Felt’s proprietary market valuation models. The most recent readings for these models is provided in The Valuator. A minus reading means our stock universe is below its “fair value,” according to that model. From left to right, the cones (sometimes we might use bars) represent the RAM, RAMT, and the Historical Model. The RAM is our Interest-Rate-Adjusted Equally-Weighted Valuation Model, or “Rate Adjusted Model” for short). The RAM is similar to the “Fed Model” in that both models base their “Fair Value” estimates on earnings, stock prices, and the interest-rate environment. However, the “Fed Model” is an Interest-Rate-Adjusted Large-Cap Valuation Model for the S&P500 Index (compare this description and the one above for the RAM). The S&P500 Index weights large-cap stocks more than mid-cap or small-cap stocks. These weightings make the S&P500 a “large-cap Index.” Yet, Morningstar defines more than half of the stocks in this Index as either mid-cap or small-cap. Earnings estimates for the large-cap stocks used in the “Fed Model” calculations are more heavily weighted. Institutional investors often buy more or less of a stock in accordance with its weighting in the Index, but individuals do not. Therefore, a valuation model that gives equal treatment to all the stocks in our universe has more meaning for individual investors. That is what the RAM does.
The “Fed Model” uses earnings estimates for the next 12 months. However, we believe analysts can make more reliable earnings estimates when looking ahead only 6 months. Hence, the 12-month earnings estimates used in the RAM combine what was actually earned during the last six months with projections for the next 6 months. In general, the market also tends to “look ahead” about 6 months. We believe the RAM is less speculative and more reliable than the “Fed Model” (and more practical for individual investors). With either the “Fed Model” or the RAM, the market may attain “Fair Value” through a change in interest rates rather than a change in stock prices. RAMT differs from the RAM in that when there are a few individual stocks with extremely deviant readings, it includes those readings in such a way that they will not inappropriately skew the results for our whole universe of stocks. The RAM gives the actual reading. RAMT, on the other hand, is a theoretical construct that is not subject to the skewing effects caused by a few extreme analysis-units. At the same time, it does not ignore their existence. If you are interested in the actual readings for our primary stock universe, including the skewing influence of stocks that are at either extreme of the valuation spectrum, use the RAM. If you want a reading for the (theoretical) typical stock in our universe, use RAMT.
The third cone pertains to our Historical Valuation Model. We base this estimate of fair value on the relationship that has existed between the data used to measure a company’s business fundamentals and the price action of its stock in corresponding years. The relationship is unique for each stock (the market reacts to the earnings of each company in a unique way, and it treats biotech firms differently than cosmetic firms). We use this information in conjunction with the current thinking of analysts regarding the business outlook of the company in order to determine what the historical relationships say the stock’s “Fair-Value” is in view of the company’s current financial outlook. As above, our “current” outlook combines data for the past 6 months with the latest projections for the next 6 months. The model computes a “Current Value” and “Fair Value” for all the stocks covered as a group.
The RAM and Historical Model are very different ways of measuring value. The RAM looks at the relation between earnings yield and current interest rates. The Historical Model looks at the historical relation between earnings and stock price-action. ~ Dr. Felt
Follow-up Note: We used the above system for measuring “Fair Value” in The Valuator for over 30 years. We still believe it is the best approach to use based on analyst’s earnings estimations. However, we have recently changed our model to a probability-based system. Earnings reports take time to generate. Analysts usually report every 3 months. Things can happen between those reports. Are earnings estimates made at the beginning of a three month period still accurate and as on-target as the estimates at the beginning of the next quarter for the same company? Are the estimates different?
Now, each stock we track is still given a unique model. The probability model we now use is generated the day The Valuator is ready for publication (when published on weekends, it is based on Friday’s closing data). In our view, this approach gives a higher probability of reaching the “Center of Gravity” more quickly, though target prices may be closer (gains are likely to be smaller, but we think more likely to be achieved and sooner). Check The Valuator for details of our current approach.