Bollinger
Bollinger Band Basics
Contributed by John Bollinger
Bollinger Bands are available on MetaStock and most charting software. They have become popular primarily because they answer a question every investor needs to know: Are prices high or low?
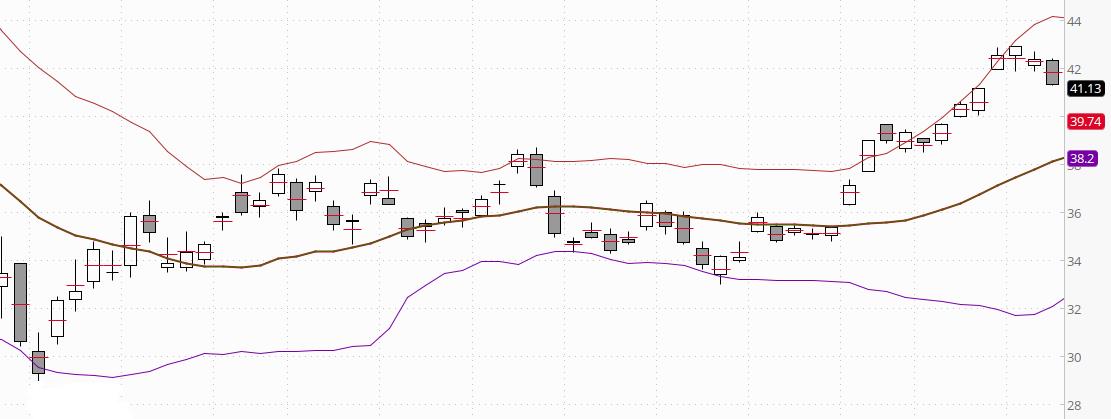
What are Bollinger Bands? They are curves drawn in and around the price structure on a chart providing a relative definition of high and low. To wit: Prices near the upper band are high, prices near the lower band are low.
The base of the bands is a moving average that is descriptive of the intermediate-term trend. This average is known as the middle band and its default length is 20 periods. The width of the bands is determined by a measure of volatility called standard deviation. The data for the volatility calculation is the same data that was used for the moving average. The upper and lower bands are drawn at a default distance of two standard deviations from the average.
These are the standard Bollinger Band formulas
Upper band = Middle band + 2 standard deviations
Middle band = 20-period moving average
Lower band = Middle band – 2 standard deviations
To teach you how to use Bollinger Bands effectively would take a book, however the following rules serve as a good beginning point.
15 Basic Rules for Using Bollinger Bands
1. Bollinger Bands provide a relative definition of high and low.
2. That relative definition can be used to compare price action and indicator action to arrive at rigorous buy and sell decisions.
3. Appropriate indicators can be derived from momentum, volume, sentiment, open interest, inter-market data, etc.
4. Volatility and trend already have been deployed in the construction of Bollinger Bands, so their use for confirmation of price action is not recommended.
5. The indicators used for confirmation should not be directly related to one another. Two indicators from the same category do not increase confirmation. Avoid colinearity.
6. Bollinger Bands can be used to clarify pure price patterns such as M-type tops and W-type bottoms, momentum shifts, etc.
7. Price can, and does, walk up the upper Bollinger Band and down the lower Bollinger Band.
8. Closes outside the Bollinger Bands can be continuation signals, not reversal signals–as is demonstrated by the use of Bollinger Bands in some very successful volatility-breakout systems.
9. The default parameters of 20 periods for the moving average and standard deviation calculations, and two standard deviations for the bandwidth are just that, defaults. The actual parameters needed for any given market/task may be different.
10. The average deployed should not be the best one for crossover signals. Rather, it should be descriptive of the intermediate-term trend.
11. If the average is lengthened the number of standard deviations needs to be increased simultaneously; from 2 at 20 periods, to 2.1 at 50 periods. Likewise, if the average is shortened the number of standard deviations should be reduced; from 2 at 20 periods, to 1.9 at 10 periods.
12. Bollinger Bands are based upon a simple moving average. This is because a simple moving average is used in the standard deviation calculation and we wish to be logically consistent.
13. Be careful about making statistical assumptions based on the use of the standard deviation calculation in the construction of the bands. The sample size in most deployments of Bollinger Bands is too small for statistical significance and the distributions involved are rarely normal.
14. Indicators can be normalized with %b, eliminating fixed thresholds in the process.
15. Finally, tags of the bands are just that, tags not signals. A tag of the upper Bollinger Band is NOT in-and-of-itself a sell signal. A tag of the lower Bollinger Band is NOT in-and-of-itself a buy signal.
These rules outline the basic guidelines for using Bollinger Bands. For a more comprehensive understanding of the bands, I suggest that you read “Bollinger On Bollinger Bands”. The book starts with the basics, builds to the complex and teaches the technical analysis process including which indicators to use and how to read charts.
The Bollinger Band Tool Kit for MetaStock provides easy to use implementations of all the trading systems and indicators from the book.
John Bollinger, CFA, CMT is probably best known for his Bollinger Bands, which have been widely accepted and integrated into most of the analytical software currently in use. He is the president of Bollinger Capital Management, a money management firm, and publishes a monthly newsletter, The Capital Growth Letter. He has eight financial websites: www.BollingerBands.com, www.BollingerOnBollingerBands.com, www.EquityTrader.com, www.FundsTrader.com, www.GroupPower.com, www.MarketTechnician.com, www.PatternPower.com and now a forex site, www.BBForex.com.