Original price was: $25.00.$0.00Current price is: $0.00.
See description lower on this page.
Description

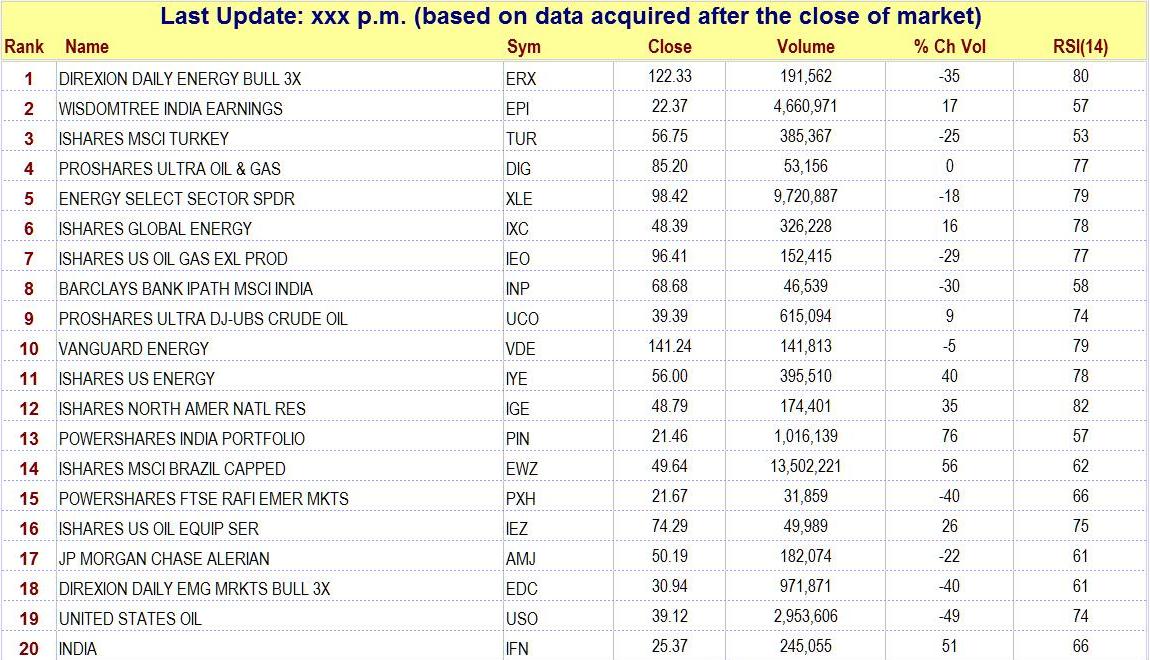
Strongest ETFs
Virtually every other website that ranks ETFs by strength uses the Relative Strength Index (RSI) to do so. That is because it is a quick and convenient upload for the operators of a website. Also, few websites have staff with the mathematical expertise necessary to create anything better. However, we do create our own algorithms and indicators. The strength algorithm we use is one of these. It is proprietary, and it is not used anywhere else on the Internet. It is far more complex than the simplistic RSI and far more effective at finding stocks that are not only strong but that also have strong chart patterns.
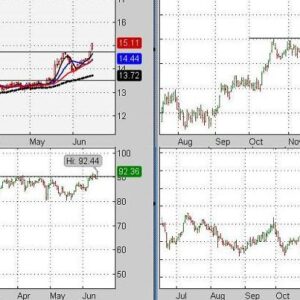
If you scan 8000 stocks with the Relative Strength Index (RSI), you will find that many of the stocks that rank high are not very attractive because of nearby overhead resistance or because the surge of strength measured is not really significant for some other reason (a non-significant rebound in a bad pattern). In fact, a stock’s chart pattern can be terrible even though its RSI is very high. The charts of stocks on the list selected by our own strength screens, however, will look much more attractive. The more stocks that are screened, the greater the difference in output will be. When you look at ETFs ranked highest by our strength indicator, you will know you are looking at ETFs that are the strongest available. (Incidentally, the image above, when expanded, looks much smaller than it really is. Use the “Strongest ETFs” tab on the left side of your screen to see a more accurately rendered list).
Here is a sample strategy. A person could select the top ten ETFs and hold them until one falls out of the top 30 list (the ETF in the 30th place is in bold type for easy reference). The “drop-out” could then be replaced with the highest ranking ETF not currently in the portfolio. In this way the portfolio will become weighted to favor the strongest sectors or markets in the world. Adjustments could be made once a week, once a month, or whatever. For some other ideas, click on the “Strongest ETFs” tab on the navigation panel (left side of your screen), and read the strategies mentioned there. Why pay a money manager 1% to 3% of your investment assets to manage your portfolio when you could create your own portfolio that is always invested in the strongest ETFs?
Though we do not use the RSI to determine which ETFs will be included on the list, we do include an RSI reading and a volume change reading for each scan. They are included because some subscribers may find a use for them in selecting an ETF for purchase. For example, an ETF that is rebounding from support (a rising trendline, for example) with a surge in volume is much more attractive than an ETF that rebounds from support with a decrease in volume.
Begin the ordering process by clicking on “ADD TO CART” at the top of this page
The main menu has a link to “Strongest ETFs” Unless you have already been there, use that link to get additional information.
Return to the “Products & Prices” page
Also, before ordering, read this important message.
Related products
-
Sale!
Strongest Stocks
Original price was: $25.00.$0.00Current price is: $0.00. Add to cart -
Sale!
Stops (S-200)
Original price was: $25.00.$0.00Current price is: $0.00. Add to cart -
Sale!
ETF Alerts
Original price was: $25.00.$0.00Current price is: $0.00. Add to cart -
Sale!
Breakout
Original price was: $25.00.$0.00Current price is: $0.00. Add to cart