Moving Average Signals
Moving Average Buy/Sell Systems
Using The Moving Average As A Buy and Sell Tool
By Dr. Winton Felt
The diagrams below illustrate some rules employed by many traders who use moving averages to generate buy and sell signals. The problem with using moving average crossovers as actionable signals is that stocks may whipsaw back and forth across the moving average. It is important to wait for a good “setup” (see the setups discussed in the description of “StockAlerts“) before acting in order to avoid being whipsawed in and out of the stock (and to avoid excessive trading commissions). Whipsawing occurs primarily when the stock is not trending. Traders use other tools to identify non-trending situations early so they can switch to strategies that work better in non-trending environments. Most traders who use moving average crossover systems consider any extra trades they might make to be the price one must pay to be positioned correctly when the stock finally stops whipsawing and begins to trend. In general, traders consider the benefit of the strategy to be that it enables a trader to enter a position close to the beginning of a trend and to leave near the end of the trend..
Some traders reduce the number of “false signals” by using the move of a short-term moving average across a longer-term moving average as the signal mechanism rather than the crossover by a stock’s price. A 5-day moving average is less likely to whipsaw back and forth over a 50-day moving average than is the closing price of the stock. Traders use combinations of moving averages like 5 and 30, 5 and 50, 20 and 200, 10 and 100 and many others based on how active they want to be as traders. Generally, the longer the moving average the better established the trend it represents and the less likely it is to be generating a false signal. On the other hand, longer moving averages give up more of the profit potential of a trade because they are slower in generating their signals. There are tradeoffs here that only the individual trader can resolve through experience. Remember that the rising trend of an undervalued stock is more likely to be sustained (less likely to break down) than the trend of an overpriced stock. Price relative to earnings (PE or PE-ratio), sales (PSR or Price Per Sales ratio), and earnings rate-of-growth (PEG or PEG ratio) are among the factors that give fuel to the momentum of a trend. Sometimes investor psychology does too, but trends based on psychology alone are more apt to undergo unexpected reversals. Prefer stocks that are a good value. Making good use of valuation measurements like those found in The Valuator can increase the odds of a successful trade.
The following illustrations pertain to moving average resistances, supports, and crossovers. A stockdisciplines.com trader has tested both exponential and simple moving averages and has found that a simple moving average is preferable to an exponential moving average. The longer the moving average, the more reliable these rules tend to be. We make no recommendations to buy or sell any stock. To the best of our knowledge, Joseph E. Granville was the first to describe the following price versus moving average configurations. We refer you to his book, A Strategy of Daily Stock Market Timing for Maximum Profit.
1. If the moving average line flattens out after a significant decline, or has begun to rise, and the price of the stock passes upward through the moving average line, it is considered to be a buy signal. The same holds true if the moving average flattens out or rises after the stock has passed upward through the moving average line.
2. If the moving average is still rising aggressively and the price of the stock falls below the moving average, this is considered to be a buying opportunity.
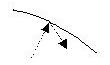
3. If the stock price is above the moving average, declines to the moving average but fails to go through it and starts to turn up again, this is a buy signal.
4. If the moving average is declining and the stock price falls under it too fast, it is likely to return to the moving average. The stock can be bought to profit from this short-term snap-back. It might be helpful for you to know that when our stockdisciplines.com traders are using this technique, they generally prefer to wait for some sign that the downward momentum is abating or that it has actually reversed before the purchase.
5. If the moving average has been rising and then it flattens out, or if it is declining, and the price of the stock passes down through the moving average, it is considered to be a sell signal. The same thing holds true if the flattening out of the moving average or its decline occurs after the stock has passed downward through the moving average.
6. If, while the moving average is falling, the price of the stock rises above the moving average, this is also an opportunity to sell at a good price before the stock resumes its decline.
7. If the stock price rises toward a moving average from below, but fails to go through it and starts to turn down again, the resistance offered by the moving average is too strong for the stock and it is a sell signal.
8. If the stock price moves rapidly above the rising moving average line too fast, it is likely to have a reaction move back toward the moving average and the stock can be sold for a short-term technical reaction. It is generally best to wait for some sign that the upward momentum is abating or that it has actually reversed before the sale.
It is wise to use more than a moving average to define buy and sell points. Shrewd investors learn to use a variety of indicators in concert. It is also helpful if the stock’s fundamentals are in alignment with the signal generated. For example, if the stock has given a buy signal, it is a big advantage if the stock is also undervalued. Following a discipline adds clarity and purpose to an individual’s trading. It also enhances a person’s resolve when emotions run amok and the circumstances create confusion and indecision.