Interest Rate Spread
Short-Term vs. Long-Term T-Rates
Relationship Between Short-term and Long-term Treasury
Rates: What the Interest Rate Spread Tells You
In the chart, the light line (ST) traces the yield of short-term (13-week) treasuries and the dark line (LT) traces the yield of long-term (10-year) treasury bonds. Divide the numbers on the scale by ten to get the yields on these investments. For example, at the vertical line (4/30/02), LT rates were 50.9 ÷10 = 5.09% and ST rates were 17.3 ÷10 = 1.73% (ST rates were 3.36% less than LT rates). When ST rates are 1.3% to 2% below LT rates, investors expect normal economic growth (2-3 percent per year). When the spread is greater, they expect even faster growth because the Central Bank is likely pushing rates down. This reduces the cost of borrowing for companies so they can expand capital investment. When ST rates are higher than LT rates, Central Banks are probably trying to curb inflation. Economic conditions are expected to deteriorate. When ST rates exceed LT rates by 1.5% or more, there is a 70% chance the economy will go into recession within the next 12-months. The foregoing can serve as an investment guide. If ST rates are higher than LT rates, tighten stops or take other protective measures. If they are 1% or more higher, consider moving to cash (notice that the ST curve was this far above the LT curve in 2000 and that a 3-year bear market began in that year). When ST rates are less than 1% below LT rates, stable growth stocks are attractive. When ST rates are 1% to 3% less than LT rates, stocks are even more attractive (a stock-picker’s market). If the spread is more than 3%, invest with the premise that inflation could start to heat up soon. At the time show in the chart, the spread was -.034. ~ Dr. Felt
Expanded Discussion With Some Repeating
This was taken from another location on this Website (and at a different time ). It covers the same information with different charts, with maybe a few other minor differences.
Interest Rates
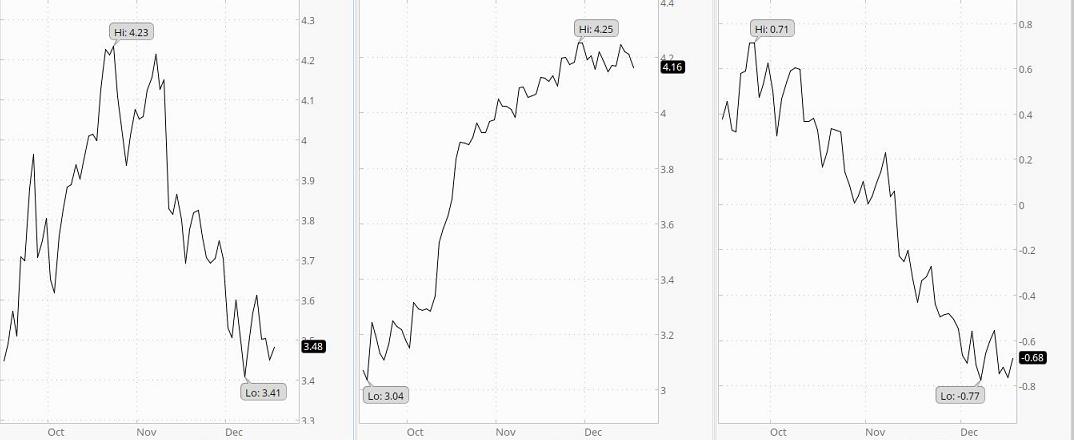 10-Year 13-Week Spread
The Interest Rates charted above are the long-term (10-year) and short-term (13-week) interest rates over recent months. The last reading (in percent) is inserted in the scale on the right side of the chart in a colored box. The spread between the two is shown in the right chart. When the spread between short-term rates and long-term rates is +1.3% to +2% (short-term lower than long-term), the economy is thought to be in for a normal growth rate in the vicinity of 2% to 3%. If the difference is more than that, it is probably because the Central Bank is making money more easily available and the economy will likely undergo accelerated growth. When companies can get cheap money, they can more easily afford to invest in projects, facilities, and equipment that will expand business or improve operations. If the interest rate spread is negative (short-term money more expensive than long-term money, then money is being made more difficult to obtain by the Central Banks (they are attempting to reduce the rate of inflation). This will, of course, slow down the amount of capital investment made by companies. Economic expansion will be mitigated. If the spread is a negative 1.5% (or even more), then the probability is 70% that economic recession will occur within a year. This information can be the basis for some general guidelines. If the spread is negative, make stop losses hug price action more snugly and use other techniques you may be aware of to guard or enhance assets in the event of market decline. If the short-term rate is enough higher that the interest rate spread is -1% or more, cash might be your best option. If the chart indicates that the current spread is .76, then the current spread is a little more than ¾ of 1%. The fact that the number is positive (the line is above zero) means the long-term rates are greater than the short-term rates. If the number is negative (the line is below zero) it means the short-term rates are greater than the long-term rates. a.) If the spread is negative, tighten stops or take other protective measures. b.) If short-term rates are 1% or more higher than long-term rates, cash might be a more appropriate investment (Remember that the bear market that began in 2000 started under these conditions). c.) When the spread between short-term and long-term money is less than 1%, higher-quality growth stocks are better candidates. d.) When short-term money costs 1% to 3% less than long-term money, stocks are generally even more likely to be profitable. A greater variety of stocks will advance in valuations. e.) If the spread is more than 3%, assume that inflation is just around the corner.