Best Sell Strategy
A Test To Find The Best Moving Average Sell Strategy
In order to develop or refine our trading systems and algorithms, our traders often conduct experiments, tests, optimizations, and so on. We have tested several sell strategies and are now sharing some of those findings. R. Donchian, popularized the system in which a sale occurs if the 5-day moving average crosses below the 20-day moving average. R.C. Allen popularized the system in which a sale occurs if the 9-day moving average crosses below the 18-day moving average. Some traders feel they give up less of the gains they achieve if they use a shorter long moving average. These people prefer to sell if the 5-day moving average crosses below the 10-day moving average. Traders have used variations on these ideas (some touting the benefits of one variation and others touting the benefits of another). One trader told us about the crossover of the 7-day and 13-day exponential moving averages. Because that system appeared to have some merit, it was included in the tests for comparison purposes. The strategies covered in this particular series of tests included all dual systems in which the shorter moving average was between 4 days and 50 days and the longer moving average was between the short moving average in length and 200 days. Here we report on some of the most popular systems and on variations of those systems.
Sell if the stock’s simple 9-day moving average crosses below its simple 18-day moving average,
Sell if the stock’s simple 10-day moving average crosses below its simple 18-day moving average,
Sell if the stock’s simple 10-day moving average crosses below its simple 19-day moving average,
Sell if the stock’s simple 9-day moving average crosses below its simple 19-day moving average,
Sell if the stock’s simple 9-day moving average crosses below its simple 20-day moving average,
Sell if the stock’s simple 10-day moving average crosses below its simple 20-day moving average,
Sell if the stock’s simple 4-day moving average crosses below its simple 18-day moving average,
Sell if the stock’s simple 5-day moving average crosses below its simple 18-day moving average,
Sell if the stock’s simple 4-day moving average crosses below its simple 20-day moving average,
Sell if the stock’s simple 5-day moving average crosses below its simple 20-day moving average,
Sell if the stock’s simple 5-day moving average crosses below its simple 9-day moving average,
Sell if the stock’s simple 4-day moving average crosses below its simple 9-day moving average,
Sell if the stock’s simple 4-day moving average crosses below its simple 10-day moving average,
Sell if the stock’s simple 5-day moving average crosses below its simple 10-day moving average,
Sell if the stock’s exponential 7-day moving average crosses below its exponential 13-day moving average,
Sell if the stock’s exponential 7-day moving average crosses below its exponential 14-day moving average.
We wanted to avoid “curve-fitting.” That is, we wanted to test these strategies over a wide range of stocks representing a variety of industries and market sectors. Also, we wanted to test over a variety of market conditions. Therefore, we tested the strategies on each of about 3000 stocks over a period of about 9 years (or over the period during which the stock traded if it traded for less than 9 years), factoring in commissions but not “slippage.” Slippage results when the sell order is for $30 but the price at which the sale is executed is $29.99. In this case, the slippage would be one penny a share. The same “buy” strategy was consistently used for each test. The only variable was the rule for selling. For each strategy, we totaled the returns on all stocks. We performed a total of 47,312 tests.
The idea behind this experiment was to find out which of these sell disciplines achieved the best results most of the time for most stocks. Remember that the profitability of a system that is applied to a single stock (even if this is repeated for 3000 stocks as in our test) does not paint the whole picture. Profitability per unit of time invested is a better way to compare systems. In conducting this test at stockdisciplines.com, we required that each system had to wait for a new buy signal in the particular stock being tested. In real life, a trader could jump to another stock immediately after a sale. Therefore the trader would have little or no “dead time” while waiting to make the next purchase. A system that is less profitable but that exits a position earlier could therefore generate greater profits over a year by reinvesting in a different security as soon as the first one is sold. On the other hand, it would be a poorer performer if it had to wait for the next buy signal on the same stock while another slower system was still holding and making money. Thus, a system that captures a 10% profit in 20 days may not compare well with another system that captures only a 7% profit in the first 10 days of that same move and then sells to take another position elsewhere.
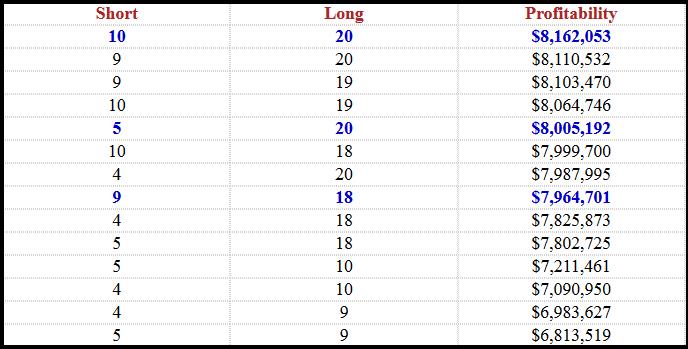
The various sell systems are arranged below in order of their profitability. The left column is the short moving average and the middle column is the long moving average. The sell signals were generated when the short average crossed below the long average. The right column is the total profitability for all stocks tested. The key item of comparison is not the actual magnitude of gain for each sell system. This would vary considerably with different “buy” and “sell” system combinations. We were not testing for the profitability of any complete system, but for the relative merit of the various “sell” systems in isolation from their respective optimum “buy” disciplines. As you can see from the table, selling when the 9-day moving average crossed below the 18-day moving average was not as profitable as selling when the 10-day moving average crossed below the 20-day moving average. Donchian’s 5-day moving average cross of the 20-day average was also more profitable than the 9-day average cross of the 18-day average. All tests were identical. The only variable was the combination of moving averages selected. The two exponential systems were at the bottom of the list in profitability.
Do not read this report without reading the follow-up report by clicking on the link below the table. The table provides only part of the story. Also, this study was not an attempt to measure the relative efectiveness of complete systems. For example, R.C. Allen’s system (as a complete system) may very well outperform either of the systems above it on the following table. The entry point of a system has a great deal to do with the profit obtained at the exit point of a system. The entry points of the various systems have been ignored in this study.
This study supports the notion that the sell side of a triple moving average system based on the 5-, 10-, and 20-day moving averages is likely to be more profitable than the sell side of the similar 4-, 9-, 18-day moving average combination. It has the additional advantage of enabling us to monitor the downward crossing of the 5-day moving average relative to the 20-day moving average. The latter is Donchian’s system, and it is a strong system in its own right (It also gives earlier signals than either the 9-18 or the 10-20 combinations). Therefore, including the 5-, 10-, and 20-day moving averages on our charts gives us an additional option. We can use the 5-, 10-, and 20-day triple moving average system to generate our sell signals or we can use Donchian’s 5-, 20-day dual moving average system. If the stock pattern does not look or “feel” right to us, the 5-day moving average cross will give us an earlier exit. Otherwise, we can wait for the 10-20 crossover. While we could distinguish differences between the top systems, it should be remembered that the differences in net total return over the entire time of testing were very small on a percentage basis. For example, the difference between the top ranked system and the one in eighth place amounted to only about 2.4%. If you spread that out over the entire time of the study, you wil see that the yearly differences are really quite small. With regard to complete systems, the 9-, 18-day system may be more profitable than either the 10-, 20-day system or the Donchian system. For those considerations and other comments and information, please see the follow-up report: A Test To Find The Best Moving Average Sell Strategy: Comments and Observations.